Quick user guide
System requirements
Description of statistics
Technical information
Downloads
Contact information
Quick user guide
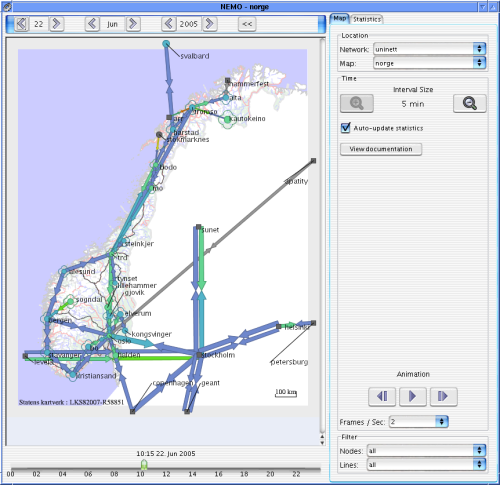
Nemo is an application that shows geographical maps with locations and lines relevant to
a computer network. It needs a connection to another server to access its database, so
you need to accept the self-signed security certificate for it to work.
What to do if it won't launch?
If your browser presents you with a window asking you what to do with the .jnlp file, it means that it is not configured to handle the Java Web Start MIME type. Tell your browser you want to open it with the 'javaws' program usually located in the /jre/javaws/ or jre/bin/ directory in your Java installation. Some versions of the mozilla web browser is known to have trouble with the security certificate, so if you get some kind of 'Unable to lauch Nemo' error you might try a different browser like Opera or Internet Explorer.Map navigation
To navigate between different maps you can hover the mouse over an area of the map that aren't occupied by a line or a point. A rectangle outline with a white box showing the mapname will appear. Click the mouse to move to that map location. If the rectangle outline covers the entire current map, it means that you will zoom out one map level if you click on it. Locations with 'flower leaves' around them indicates that it is possible to zoom closer in to get a better look. You can also select a map to view in the menu to the right in the window.Choosing statistics
Lines and points have statistics associated with them. This is indicated both by colour and size. To view the statistics currently selected, click on the statistics tab in the top right corner. Here you can choose which statistics should be associated with line colour, line size, point colour and point size in the dropdown boxes. An explanation of what the colours and sizes means are given in the space below the dropdown boxes. If a location is square shaped or a line or location is coloured grey, it means that no statistic was found for that location or line.To view statistics for a different time period other than the current time, you can move the slider at the bottom of the window or can click the arrows at the top of the window. To view a larger or smaller time period you can click on the + or - magnifying glass in the menu to the right. It is possible to view statistics for 5 minutes, 1 hour and 1 day intervals. The maximum, average or other aggregate value according to the selected statistic is shown on the map. If the 'Auto-update statistics' box is checked, Nemo will constantly check for new values to display.
To get the exact statistic values for a line or a point you can click on the desired object, and a menu will appear with the exact time of measurement and statistic value. Most lines and points also have URLs that can be clicked on in order to get more information.
Playing animations
Click on the play button near the bottom in the menu to the right. Please note that the time slider at the bottom must be set to some time in the past, or there will be nothing to play. The animation will stop by itself if it reaches the current time or the end of the slider bar. Click on the buttons to the left or right of the play button to move to the beginning or the end.System requirements
Nemo was built using Java version 1.4, so you will want to make sure you have that release or a newer one. Java Web Start is used to start the application, so you have to make sure that you have that installed, but this is usually no problem since it is included in the standard Java installation. If your browser is not set up to handle .jnlp files, you have to tell it to use 'javaws' to open that kind of files.
If you want to change the browser that opens URL links, you can run 'javaws' (The Java Web Start program) and
make your changes in the File -> Preferences -> Browser setup menu.
Description of statistics
Here we will give a short description of each statistic Nemo is capable of showing.
Peak line load (percent)
Maximum traffic for a line in a given time period measured as a percentage of the total line bandwidth. The kbits/sec value is measured in intervals between 3 and 5 minutes, and the maximum value within an hour is used to give the max line load for that hour. Peak line load for days is computed likewise.Average line load (percent)
Average traffic for a line in a given time period measured as a percentage of the total line bandwidth. The kbits/sec value is measured in intervals between 3 and 5 minutes, and the average of these values is used to compute the average line load for that hour. Average load for days is computed likewise.Line capacity (kbits/sec)
The maximum bandwidth of the line measured in kbits/second.Peak CPU load (5 sec period)
Maximum of the CPU busy load percentage in the router for the last 5 second period. The measurements are taken approximately every 5 minutes.Average CPU load (5 sec period)
Average of the CPU busy load percentage in the router for the last 5 second period. The measurements are taken approximately every 5 minutes.Peak CPU load (1 min period)
Maximum of the one minute exponentally-decayed moving average for the CPU load in the router. The measurements are taken approximately every 5 minutesAverage CPU load (1 min period)
Average of the one minute exponentally-decayed moving average for the CPU load in the router. The measurements are taken approximately every 5 minutesAverage packetloss
Average loss of packets to a router, measured in percent.Ping time (max)
Maximum ping time to a router, measured in milliseconds.Ping time (median)
Median ping time to a router, measured in milliseconds.Technical information
Start Nemo in debug mode.Nemo consists of a Java client that accesses a database to fetch coordinates, URL links, statistics and various other information. The database is fed with a number of scripts that are run at regular intervals to keep everything up to date.
Database
We used PostgreSQL as our DBMS, and the database ER-diagram can be found here. To add new statistics to the database, a new database table for the statistic values must be created. The table must include the mandatory columns for line_id or point_id and timestamp. In addition a number of optional statistic value columns can be supplied.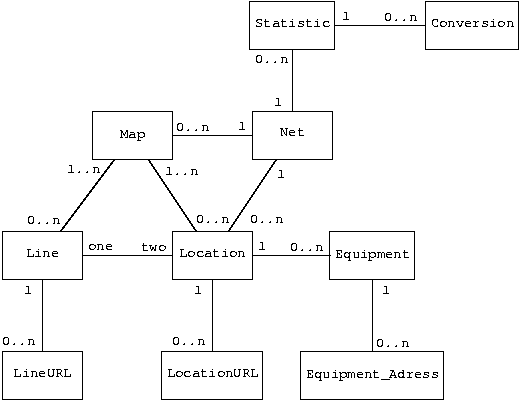
In order for Nemo to recognize and display the new data, entries must be added to the statistic table and to the conversion table.
statistic table
| column name | datatype | description | other information |
|---|---|---|---|
| stat_name | text | name of the statistic | primary key |
| timespan | text | length of the statistic interval | values: 5min, hour or day |
| net | text | name of the network | references net(net) |
| stat_type | text | statistic assosciation | values: pointcolour, pointsize, linecolour, linesize |
| statistic_table | text | name of the statistic table as it is in the database schema | |
| statistic_column1 | text | name of the first statistic column as it is in the database schema | |
| statistic_column2 | text | name of the second statistic column as it is in the database schema | only in use for line statistics |
| equipmentvalue_table | text | name of the equipment value table as it is in the database schema | only in use for point statistics |
| equipmentvalue_column | text | name of the equipment value column as it is in the database schema | only in use for point statistics |
| unit | text | measure unit of the statistic (ms, % or other unit) | |
| description | text | textual description of the statistic | |
| stat_url | text | not currently in use |
Line statistics make use of both statistic_column1 and statistic_column2, one for in values and the other for out values. Points
use only statistic_column1.
Points may also have equipment assosciated with them, and the statistics for the equipment is stored in an equipment value table.
conversion table
| column name | datatype | description | other information |
|---|---|---|---|
| stat_name | text | name of the statistic | references statistic(stat_name) |
| interval_start | integer | start of the statistic value interval | |
| interval_end | integer | end of the statistic value interval | |
| colour | text | RGB colour value of the given interval | on the form "rrr ggg bbb", e.g. "240 180 255" |
| size | text | size of the given interval | |
| symbol_url | text | not currently in use |
For a given set of conversion tuples that belong to the same statistic, either the colour column or size column is populated, and the other is left blank.
Scripts
A number of perl scripts run on nsa.uninett.no that gathers data from various sources and feeds them to the database. These scripts are located in /local/net-status/nemo/bin/Java client
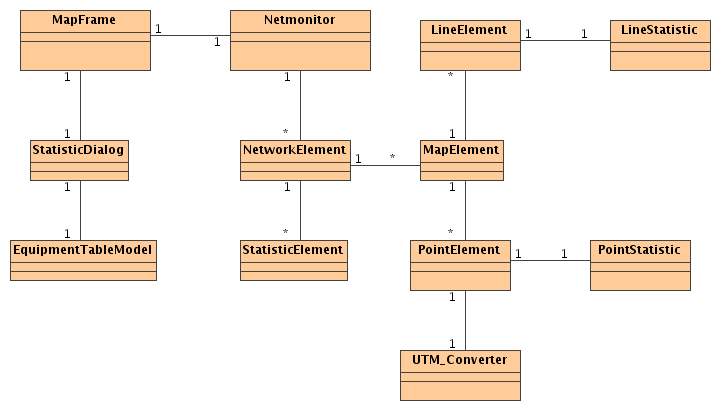
The client is written in Java version 1.4, and uses Java Web Start for deployment. The source code is checked in as a module called nemo at cvs.uninett.no/cvs. In the figure below the UML class diagram of the system is shown, and each class is described briefly in the next sections.